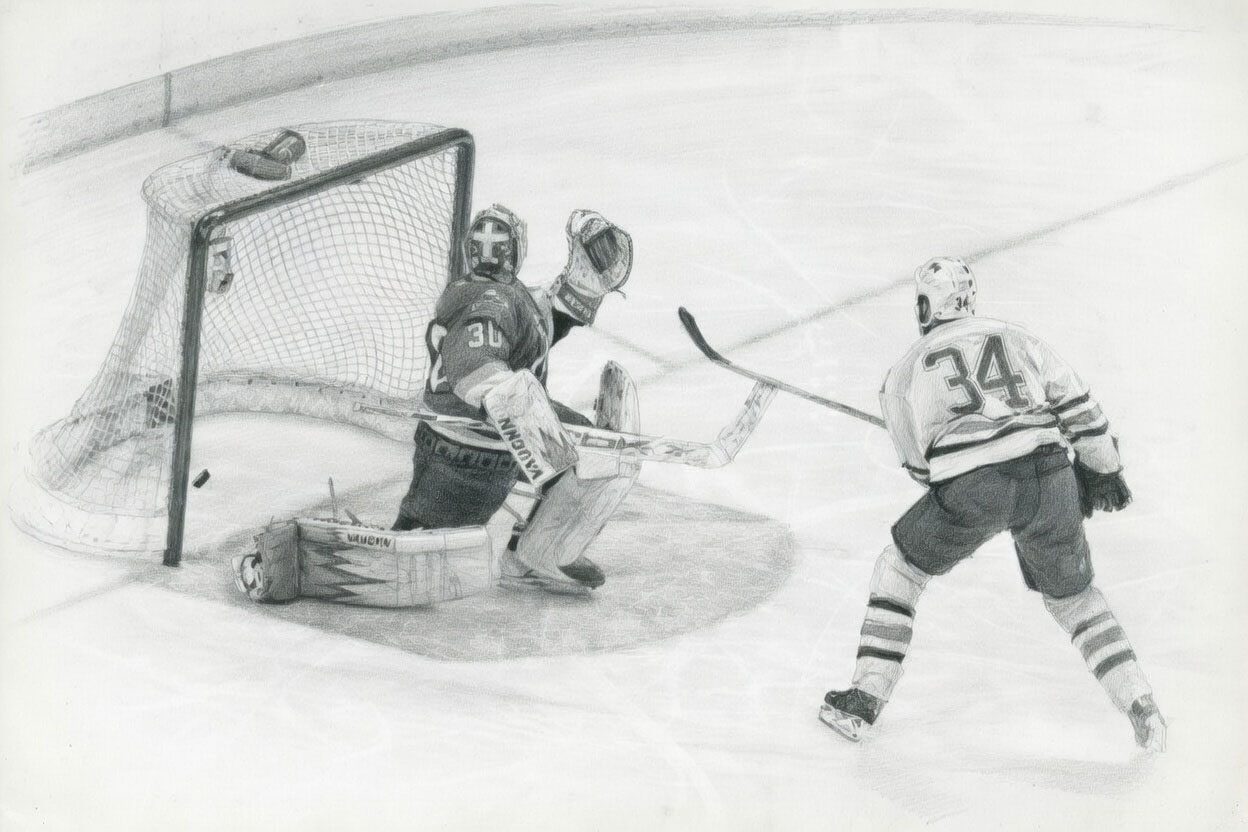
Here are the first eight full seasons of a goalie’s NHL career and then, in the last row, his career totals. You know who this is, because his name is in the title and his picture is over there, but let’s take a second and pretend. What would you think when you saw these?
| Season | Age | GP | W | L | T | GA | Sh | Sv | Sv% | GAA | SO |
| 1985–86 | 20 | 47 | 23 | 18 | 3 | 148 | 1186 | 1038 | 0.875 | 3.36 | 1 |
| 1986–87 | 21 | 46 | 22 | 16 | 6 | 131 | 1206 | 1075 | 0.891 | 2.94 | 1 |
| 1987–88 | 22 | 45 | 23 | 12 | 9 | 125 | 1248 | 1123 | 0.9 | 2.9 | 3 |
| 1988–89 | 23 | 48 | 33 | 5 | 6 | 113 | 1226 | 1113 | 0.908 | 2.47 | 4 |
| 1989–90 | 24 | 54 | 31 | 16 | 5 | 134 | 1522 | 1388 | 0.912 | 2.53 | 3 |
| 1990–91 | 25 | 48 | 25 | 15 | 6 | 128 | 1362 | 1234 | 0.906 | 2.71 | 1 |
| 1991–92 | 26 | 67 | 36 | 22 | 8 | 155 | 1806 | 1651 | 0.914 | 2.36 | 5 |
| 1992–93 | 27 | 62 | 31 | 25 | 5 | 192 | 1814 | 1622 | 0.894 | 3.2 | 2 |
| 8 Seasons | 417 | 224 | 129 | 48 | 1126 | 11370 | 10244 | 0.901 | 3.14 | 20 | |
| Career | 1029 | 551 | 315 | 131 | 2546 | 28346 | 25800 | 0.910 | 2.54 | 66 | |
Even forcing the fact that this is Patrick Roy out of your mind with a bulldozer, you’ll recognize a very fine goalie of the late ’80s and early ’90s. Then you’ll look at the career stats and say “yes, of course, all-time great.” I do not propose to surprise you with that. Everyone knows Patrick Roy was a great goalie and everyone is right. Sometimes, conventional wisdom is wise.
But see those season-by-season save percentages, then look at the bottom, to Patrick’s career save percentage. Six of Roy’s fisrt eight full seasons had save percentages below his career average; often quite a lot below. It is something of an article of faith in statistical circles that, and this fully deserves capital letters, Goalies Don’t Improve; that by the time a goalie gets to the show he’s enough of a finished article that you can’t expect a lot more from him. Patrick Roy went from a .901 save percentage in his first eight seasons to a .910 overall; a difference of thirteen, fourteen goals against a season. If a skater goes from 36-goal seasons in his mid-twenties to 50-goal seasons in his thirties we have no trouble recognizing an improvement, though we might find it somewhat mystifying. Sure, Roy went from the high-scoring 1980s to the low-scoring 2000s, he played in an era where save percentages went up, but Patrick Roy was still the same goalie. The passage of time did not improve his reflexes. In fact, the conventional story is that Roy, by popularizing the butterfly, had a lot to do with what made his era one with high save percentages; in short, Roy should have been way ahead of the field early on, as a pioneer, but come back down to earth as the butterfly became ubiquitous. This, as you can see from that table and as you remember from his career, is not what happened.
What did? Or to put it another way, was Patrick Roy improving those 13 goals a season just what goalies did if they played in that era, or was Patrick Roy even more special than we think?
Starting in 1979–80, the year of the WHA-NHL merger, NHL-wide save percentages tended to be .880 or a bit lower. 1979–80 was the best it got for over a decade, with a .882 save percentage leaguewide, and the usual ranged between .873 and .880 up until 1990–91. That year the league average save percentage was .886. In 1991–92 it rose to .888, and with the occasional blips of randomness the rise continued steadily. In 1994–95 the league average save percentage was .901, dipping back to .898 but it was back up to .905 by 1996–97. The peak was .915 in 2014–15 and 2015–16; it was over .910 for every year of the 2010s and has only started dipping after the COVID year, funnily enough coming back below .900 for the first time in a generation this past season.








Enjoyed this? Subscriptions help support future pieces. Support the site